
Introduction
Have you ever looked at your sales numbers from last year and wondered if you are actually growing? Maybe your commission checks feel bigger some months and smaller others. But how do you know if you are truly moving forward?
Here is the thing. Sales professionals who use data-driven insights earn significantly higher commissions than those who rely on intuition alone. According to recent research from Xactly’s 2026 State of Sales Compensation report, sales teams that leverage data to fine-tune their compensation strategies consistently outperform those who do not.

That is a big deal if your income depends on commission.
Many salespeople track their earnings month to month. But that only tells part of the story. You need a clearer view of your long term growth. That is where the CAGR formula in Excel comes in.
CAGR stands for Compound Annual Growth Rate. It sounds fancy, but it is really just a way to measure the steady growth rate of your sales figures over time. Instead of looking at one good month or one bad month, CAGR smooths everything out. It tells you the average annual growth rate of your commissions across multiple years. This is the kind of number that helps you make smarter decisions about where to focus your energy.
If you already know how to track your sales data, you are halfway there. But understanding what is a pivot table in Excel and how to sort columns in Excel will make your analysis even stronger. These basic Excel skills give you the power to spot trends quickly.
This article will teach you how to implement the CAGR formula in Excel and apply it to your own commission data. You will learn a simple method to measure your growth and use that knowledge to plan your next move. No complicated math required.
Ready to take control of your commission income? Explore our full library of resources to sharpen your sales skills and grow your earnings.
Let us get started.
Why Sales Analytics Matters for Commission-Based Professionals
Here is a simple truth. The numbers you track today will determine how much you earn next year. Sales analytics is not just for managers or big companies. It is for you as a commission-based professional who wants to grow your income consistently.
Tracking key metrics like conversion rates, average deal size, and monthly commission growth reveals patterns that lead to more income. For example, if your average deal size has been flat for three months, you know exactly where to focus your energy. If your conversion rate is dropping, you can adjust your pitch before you lose more deals. According to the 40 Sales Statistics to Watch for in 2026 from Salesforce, high performing sales teams are much more likely to use data regularly to guide their decisions.

Excel is the most accessible tool for this kind of analysis. You do not need expensive software or a data science degree. Once you understand how to sort columns in Excel and how to use an if statement Excel, you can start spotting trends. And if you learn what is a pivot table in Excel, you can summarize months of data in just a few clicks. If you want to dive deeper into tracking your pipeline, check out our guide on how to track your sales pipeline in Excel.
Here is another benefit you might not expect. Understanding your numbers reduces the risk of burnout. When you know which activities produce the highest returns, you stop wasting time on low impact tasks. Instead of chasing every lead, you focus on the ones that actually convert. That clarity keeps you motivated month after month.
The bottom line is simple. Sales analytics turns guesswork into a clear plan. And that plan is what helps you earn more without working harder.
Ready to start analyzing your own sales data? Check out our detailed guides to get the most out of your commission income.
Understanding the CAGR Formula and Its Role in Sales Growth Analysis
Let’s say you look at your commission income from three years ago and compare it to today. The numbers went up, but how much did they really grow each year? You might have had a huge jump one year and a flat year the next. That is where the CAGR formula in Excel becomes your best friend.
CAGR stands for compound annual growth rate. It gives you a single percentage that shows the average yearly growth of a number over time. According to Wikipedia, CAGR represents the mean annualized growth rate for compounding values over a given period. Instead of looking at the ups and downs, you get one clean number. That makes it much easier to compare your growth across different years, products, or even against other sales reps.
The formula itself is simple once you break it down. According to Corporate Finance Institute, the CAGR formula equals (Ending Value / Beginning Value) ^ (1 / Number of Periods) – 1.
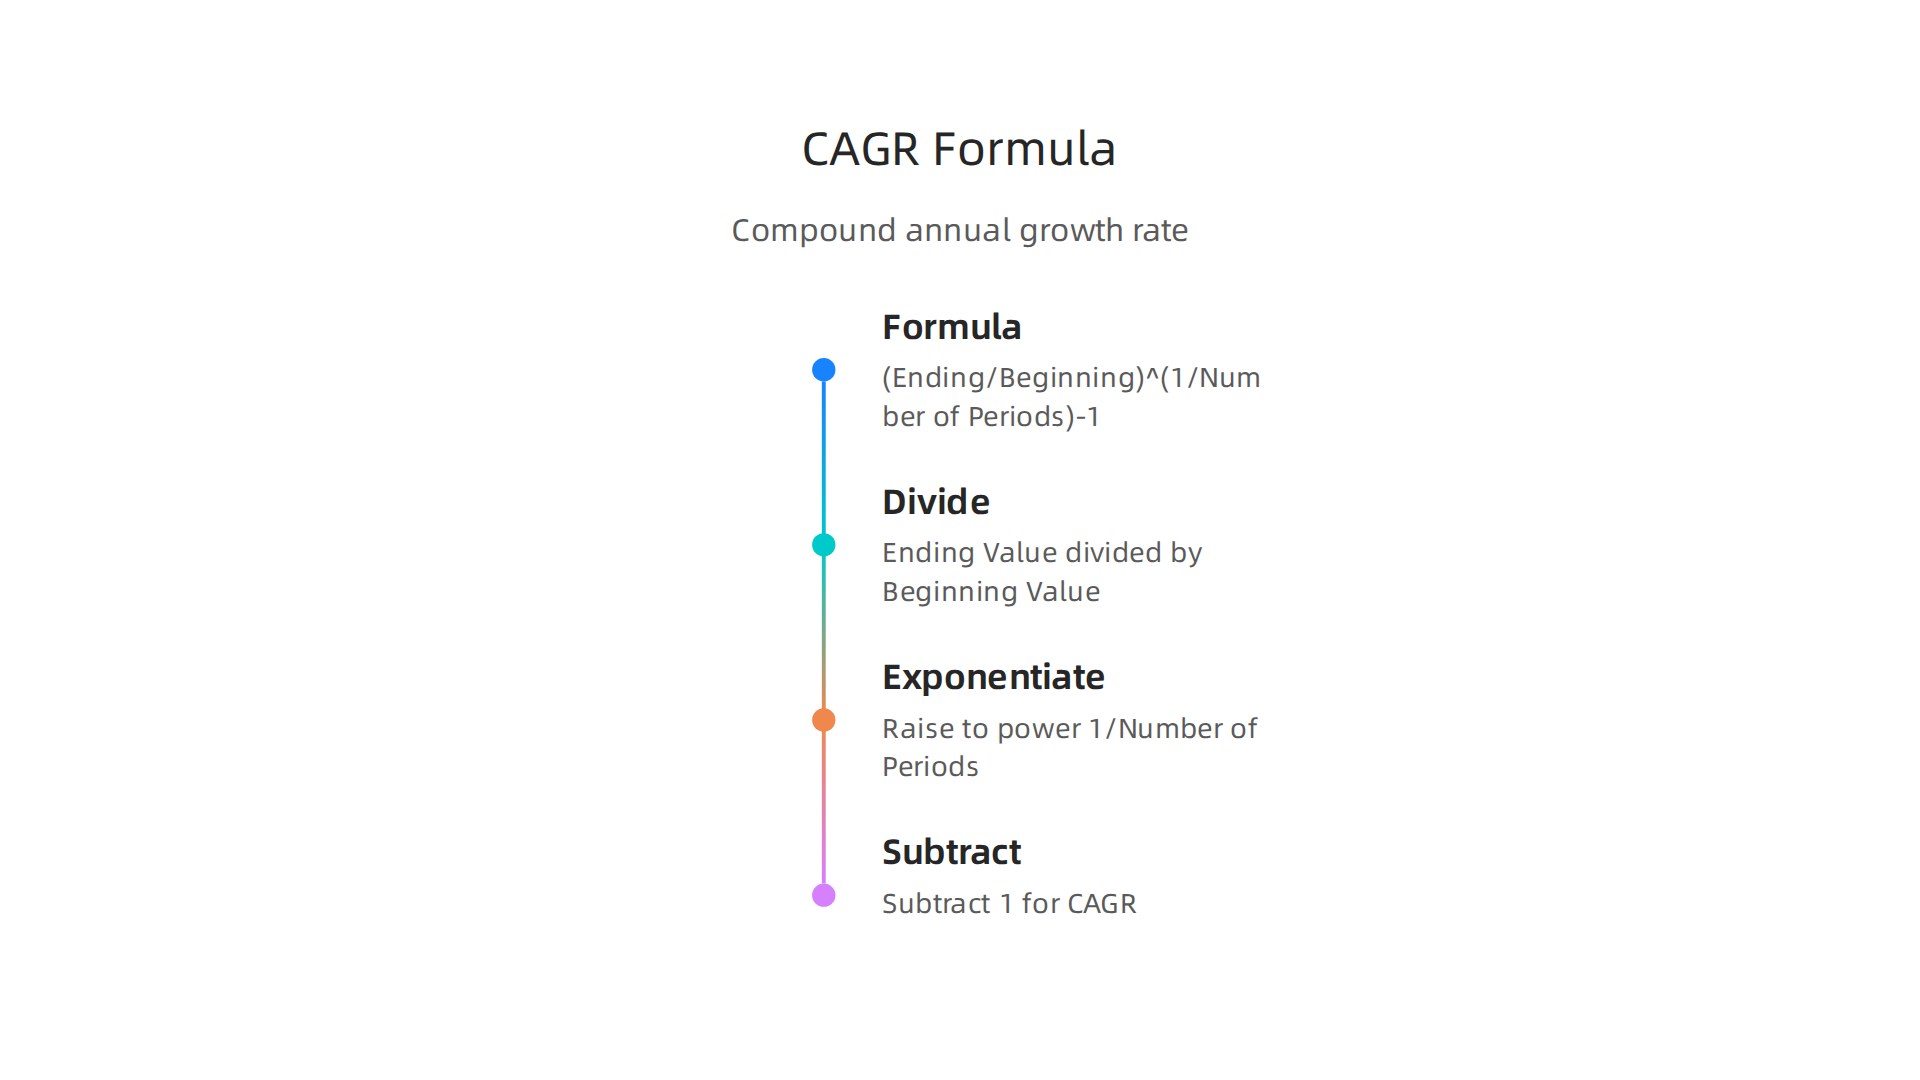
Let me walk you through it with a real example.
Imagine your monthly commission was $5,000 three years ago. Today it is $8,000. You divide 8,000 by 5,000 to get 1.6. Then you raise that to the power of 1 divided by 3 (the number of years). That gives you about 1.17. Subtract 1, and you get 0.17, or 17%. Your commission grew at an average rate of 17% per year. That is the power of the CAGR formula in Excel.
The best part is you do not have to do this math by hand. You can use the CAGR formula in Excel to calculate it in seconds. If you already know how to sort columns in Excel and use an if statement Excel, this is the next step. For a complete walkthrough on setting up your data, check out our guide on how to use Excel for commission income to track your sales pipeline and close more deals.
Once you have your CAGR, you can spot which parts of your business are growing fastest. Maybe one product line has a 25% CAGR while another is flat. That tells you exactly where to focus. You can also compare your growth rate to industry benchmarks to see if you are falling behind.
Ready to put this into action? Use the CAGR formula in Excel to measure your own growth this week. Start with your commission totals from the past three years. Then check out our other resources to keep building your skills. View Articles on our site for more practical guides.
Step-by-Step Guide: How to Use the CAGR Formula in Excel
So you know what CAGR is and why it matters for your commission income. Now, let’s get that number into Excel. You have two good ways to do this. I will show you both.
Method 1: The Manual Formula Using Exponents
This method uses the exact CAGR formula from the last section. It helps you see how the math works under the hood.
- Put your starting commission (e.g., $5,000) in cell A1.
- Put your ending commission (e.g., $8,000) in cell A2.
- Put the number of years (e.g., 3) in cell A3.
- In a blank cell, type this formula:
=(A2/A1)^(1/A3)-1 - Press Enter. Then format the cell as a percentage.
You should see 17%. This matches the CAGR formula explained by Corporate Finance Institute. The caret symbol (^) handles the exponent math automatically.
Method 2: The RRI Function (Much Easier)
Here is the thing. Excel has a built-in function called RRI that does all the work for you. It is simpler and less likely to have a typo.
The syntax is =RRI(Nper, Pv, Fv).
- Nper is the number of periods. That is cell A3.
- Pv is the present value. That is cell A1.
- Fv is the future value. That is cell A2.
So in a new cell, just type: =RRI(A3, A1, A2)
Hit Enter and format it as a percentage. You get 17% again. According to Paddle’s guide to CAGR, this function gives you the same result as the manual formula without the extra typing.
Smart Tips Before You Start
Always check two things before you calculate.
First, make sure your time periods are consistent. If you use monthly sales data, your result will be a monthly growth rate. If you use yearly data, you get an annual rate.
Second, check that your data range is complete. Missing months or zero values can give you a wrong number.
Once you build this CAGR tool in your spreadsheet, you can quickly compare how fast your commissions are growing. It turns a messy list of numbers into a clear answer.
To keep building your Excel skills, start by mastering other Excel formulas like the percentage formula to track every part of your commission check.
Want more step by step guides to grow your sales income? Read Articles on our site.
Advanced Reporting Techniques: Combining CAGR with PivotTables and Charts
You have your CAGR formula ready. That single number tells you your average growth rate. But what if you want to compare growth across different products, sales reps, or regions? That is where PivotTables come in.
PivotTables let you break down your data fast. For example, if you have a spreadsheet with product names, sales reps, and quarterly commissions, a PivotTable can calculate CAGR for each product or rep in seconds.

You just drag fields and drop them. It turns a messy list into a clear summary. If you have never used one, learning what is a pivot table in excel is simpler than you might think. Many experts recommend PivotTables as the best way to analyze sales data because they let you see patterns quickly. The Journal of Accountancy explains how combining PivotCharts with slicers turns static reports into interactive dashboards.
Once your PivotTable is ready, add a line chart. A line chart with a CAGR trendline shows your stakeholders how your commissions are growing over time. It is much easier to look at a chart than a table of numbers. According to a Statology guide on five essential Excel charts, line charts are the go-to choice for analyzing trends in 2026.
You can also use conditional formatting to highlight winners and losers. Set a rule: if CAGR is above 20%, color the cell green. If it is below 5%, color it red. That way you instantly see which products are soaring and which need attention. No more scanning rows of decimals.
This kind of reporting makes your numbers tell a story. Managers love it. It shows you are not just collecting data but actually understanding it.
If you want to build a complete dashboard for your commission tracking, start with a sales pipeline template to organize your deals. Then apply these techniques to turn raw data into a powerful growth report.
Ready to take your reporting to the next level? Explore more guides and resources on our site. Read Articles.
Applying CAGR to Track Commission Income Trends and Identify Opportunities
You have built the charts and combined them with PivotTables. Now it is time to use that cagr formula excel work to find real opportunities to grow your paycheck. The goal is not just to look at numbers but to understand what they mean for your future earnings.
Benchmark your personal performance first. Calculate your personal commission CAGR on a monthly or quarterly basis. Are you growing faster than this time last year? Many sales professionals track their totals but never actually calculate their true growth rate. The cagr formula excel makes this simple. Just enter your starting commission and your ending commission over a set number of periods. According to the 2026 State of Sales Report, most sales reps miss their targets. Having a clear view of your own trend gives you a serious advantage.
Compare your different income streams. If you sell multiple products or serve different client types, do not treat them all the same. Use CAGR to see which stream is really working for you. You might find that Product A has a CAGR of 25% while Product B is flat. That tells you exactly where to spend your time. You can even use an if statement excel formula to automatically flag products with a CAGR below your average. That saves you hours of manual sorting. Industry data from the Sales Commission Statistics 2026 analysis shows that commission rates vary a lot by sector. Knowing which product line has the highest growth rate helps you invest your energy where it pays off the most. If you need a structured way to organize these different streams, our guide on how to use Excel for commission income walks you through setting up a solid pipeline tracker.
Spot trends early. A rising CAGR on a newer product is a clear signal that it is gaining traction. A flat or falling CAGR on an established product means it might be time to pivot or revitalize your approach. This is where the real opportunity lives. You are not just looking at history. You are predicting where to go next. Sales Productivity Statistics for 2026 highlight that top performers consistently analyze their pipeline to reallocate their time to the highest value activities.
Actually, the simple cagr formula excel calculation is one of the most powerful tools in your sales toolkit. It turns vague feelings about how things are going into hard data you can act on. If you want to build a complete strategy around your commission income, we have more resources to help you succeed. Read Articles.
Common Mistakes When Using CAGR in Sales Analytics (and How to Avoid Them)
You have your cagr formula excel running and you see a nice growth number. That feels good. But here is the thing. That single number can be very misleading if you do not watch out for a few traps. Let me walk you through the most common mistakes people make when using CAGR for sales analytics and how to fix them.

Mistake 1: Zeros or negative starting values break the formula
The standard CAGR formula divides by your starting value. If that starting value is zero or negative, you get an error or a meaningless result. This happens a lot in sales when you start a new product line from scratch or have a bad month with no commissions.
How to avoid it: Wrap your CAGR formula in an IFERROR function. For example, =IFERROR((End/Start)^(1/Periods)-1, "N/A"). This is a simple if statement excel trick that keeps your spreadsheet clean. If you have negative starting values, consider using an alternative metric like simple average growth instead. The team at Revenue Growth Calculation explains several options for handling tricky data.
Mistake 2: CAGR assumes steady growth and hides volatility
CAGR gives you one smooth rate as if your income grew perfectly every month. But real sales are bumpy. You might have great months and bad months. A high CAGR could be hiding wild swings that are risky.
How to avoid it: Do not stop at CAGR. Calculate the standard deviation of your monthly returns to see how much your commissions actually bounce around. If you have a 20% CAGR but a high standard deviation, you have an unstable income stream. The Sales Commission Statistics 2026 report shows that commission rates vary a lot by sector, so knowing your volatility is key. You can also use a what is a pivot table in excel approach to average out the noise and spot the real trend.
Mistake 3: Using inconsistent time periods
This one is sneaky. You calculate CAGR over 12 months for one product but over 4 quarters for another. Those numbers are not comparable. The formula works only when each period is the same length.
How to avoid it: Always convert everything to the same time unit before calculating. For monthly data, use monthly periods. For quarterly, use quarters. If you need to compare different products with different start dates, standardize them first. A quick excel tutorial tip: use the DATE function to create a consistent timeline. And if you are mixing weeks and months, stop. Pick one.
If you want to clean up messy data before running any formulas, our guide on how to use Excel for commission income shows you how to set up a pipeline tracker that keeps everything in order.
CAGR is a powerful tool when you use it correctly. Avoid these traps and you will get numbers you can actually trust to grow your paycheck. Ready to take your sales analytics further? Read Articles for more tips on mastering your commission income.
Integrating Excel Sales Reports into Your Daily Workflow for Maximum Impact
You have your cagr formula excel working and you know the common traps to avoid. Now what? A great growth number is useless if it just sits in a spreadsheet collecting dust. The real magic happens when you build your sales reports into your daily routine.

Here is how to do that without adding hours to your week.
Set a consistent update schedule
Pick a day and time each week or month to update your pipeline and commission tracker. Treat it like a meeting with yourself. Maybe every Friday afternoon you spend 30 minutes updating your cagr formula excel calculations, adding new leads, and checking your progress. This habit keeps your numbers fresh and stops you from relying on gut feelings.
If you are new to building a tracker, our guide on how to use Excel for commission income walks you through a simple system that updates quickly.
Automate your data with Power Query
Manual data entry is boring and leads to mistakes. Excel has a built in tool called Power Query that can pull data from your CRM, email, or other sources automatically. Once you set it up, you just click Refresh and your entire report updates. This is a great excel tutorial topic to master.
For example, you can use Power Query to import your monthly sales transactions, clean the data, and load it into a pivot table. The Journal of Accountancy explains how to create interactive dashboards using pivot tables and slicers that refresh with one click. This saves time and eliminates copying errors.
You can also learn how to use a what is a pivot table in excel to summarize your commission data by product, region, or rep. Pair that with a slicer for filtering, and you have a dashboard that answers questions fast.
Share your reports to get support
Your manager or mentor wants to see you succeed. A clean, well organized Excel report shows you are serious about your numbers and your growth. Share your dashboard monthly in a one on one meeting. Point out your cagr formula excel results, highlight wins, and ask for help on areas where growth slowed.
When you present data visually, you demonstrate value. Start with a few essential charts. The team at Statology recommends five essential Excel charts every analyst should know including line charts for trends and bar charts for comparisons. Use these to tell the story of your sales performance.
If you need to clean up your data before building reports, our guide on how to remove duplicates in Excel for accurate sales commission calculations can save you headaches.
Make it stick
Integrating reports into your workflow does not have to be complicated. Pick one small habit this week. Maybe set a recurring calendar reminder to update your pipeline on Friday. Or spend 20 minutes learning Power Query basics. Small steps add up to big improvements.
Ready to explore more ways to boost your commission income? Read Articles for practical guides and strategies.
Conclusion: Turn Data into Dollars with the CAGR Formula
You started with a simple question: How fast is my sales pipeline growing? The cagr formula excel gave you a clear, objective answer. No more guessing. No more cherry picking your best months. One number tells you the real story of your sales growth over time.
Here is the payoff. When you know your compound annual growth rate, you can look back and see which products, regions, or reps actually drove results. You can spot a slow quarter before it becomes a trend. And you can take action early, instead of reacting after the numbers turn red.
The next step is to build this into your regular analysis. Use the cagr formula excel alongside other tools like a what is a pivot table in excel to break down your data by rep, region, or deal size. Add conditional formatting with an if statement excel to flag accounts that need attention. Small additions like this make your reports more powerful.
There is one more win you get from this. The confidence that comes from data mastery is a real competitive advantage in any commission based role. When you walk into a meeting with your manager or negotiate a new role, you are not relying on gut feelings. You have numbers that back you up.
To get the most out of your data, avoid common preparation mistakes. Copy paste errors and missing rows can throw off your entire growth rate. Many analysts waste hours on manual cleanup, as the experts at Scalingwise point out in their guide to fixing Excel data preparation mistakes. Automate where you can and double check your inputs.
Your sales commission income depends on your ability to see where growth is happening and where it is stalling. The cagr formula excel gives you that vision. Pair it with a solid pipeline tracker like the one in our guide on how to use Excel for commission income and you will have a complete system.
Are you ready to turn data into dollars? View Articles for more practical guides and strategies to boost your commission earnings.
Summary
This article explains how to use the CAGR formula in Excel to measure the true, average growth of your commission income over time and turn scattered monthly numbers into actionable insight. It defines CAGR, walks through the manual exponent formula and the built‑in RRI function, and gives a step‑by‑step example you can copy into your spreadsheet. The guide shows how to combine CAGR with PivotTables, charts, conditional formatting and simple IF formulas so you can compare products, reps or regions and spot opportunities fast. It also highlights common pitfalls—like zero starting values, inconsistent time periods, and volatility—and practical fixes such as IFERROR wrappers and checking standard deviation. Finally, the article covers workflow tips including scheduled updates, Power Query automation, and sharing dashboards so your growth analysis actually influences decisions. After reading, you’ll be able to calculate CAGR in Excel, interpret what it does and doesn’t show, and integrate the metric into a repeatable commission‑tracking system.