
Introduction: Why Excel Skills Are the Secret to Doubling Your Commission Income
Why do some salespeople earn twice as much as others who seem just as busy? The answer might surprise you. In 2026, the ability to work with data is a superpower for anyone working on commission.

Most office workers use Excel regularly. But top salespeople use it to predict their income and find their best leads. This specific skill is so valuable that it can add over $15k to your yearly pay. If you want to earn more in sales, learning to use spreadsheets is one of the smartest moves you can make. Free Excel training is an investment that pays for itself very quickly.
Getting started is easier than you think. You can begin with free resources and practice online. Once you learn a few basics, you will wonder how you ever managed your pipeline without it. For example, knowing how to remove duplicates in Excel is crucial for keeping your commission data clean and accurate.
To speed up your learning, it helps to have a structured plan. Check out this guide on how to choose online learning platforms for commission sales training to find the best course for your goals.
In this article, we will walk through the most powerful ways to use Excel specifically for commission earners. You will learn how to manage your pipeline, close more high-ticket deals, model your commissions, and use your data to stay motivated. Let us get started.
Why Excel is an Essential Tool for Commission-Based Sales Professionals
Imagine you have a pipeline full of prospects, but you cannot tell which ones are hot and which ones are cold. You guess your income every month, and you spend hours manually sorting data. That is a recipe for stress and lost money.
Here is the thing: in 2026, Excel is the most practical tool to fix all of that. Two out of three office workers use Excel at least once every hour, according to research by Acuity Training. Salespeople who treat spreadsheets like a partner gain a real edge. They can see exactly where every deal stands, forecast their commission checks with confidence, and model what happens if they close one more big sale.
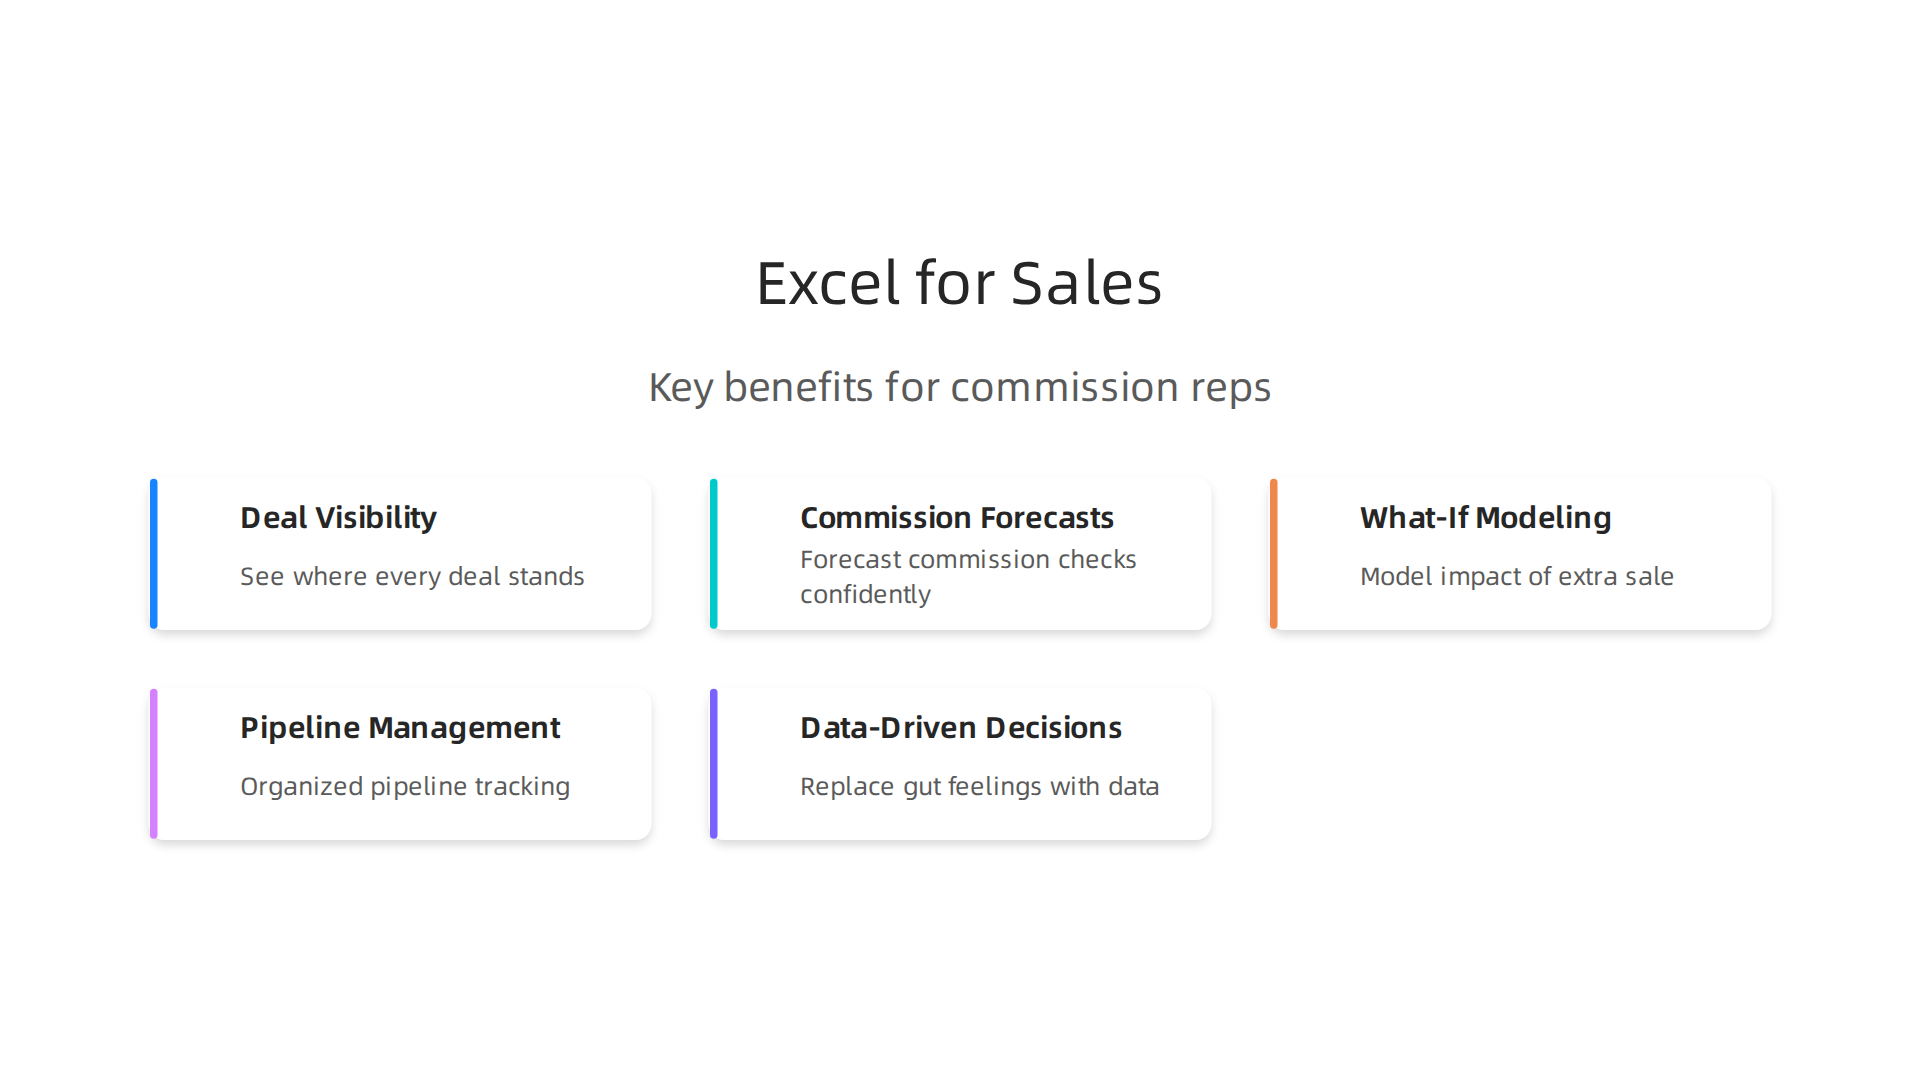
This is not just about being organized. It is about trust. When you walk into a meeting with a manager or a client and show clean, data-backed numbers, you look like a pro. You make decisions based on facts, not gut feelings. Employers actively look for these skills, and roles like a sales analyst or top commission earner almost always require spreadsheet know-how, as noted in the GoSkills roundup of in-demand Excel abilities.
The beauty is that you do not need to become a full-time data expert. A few functions can shave hours off your week. For example, learning how to freeze a column in Excel keeps your header row visible when scrolling through hundreds of leads. That small trick alone saves constant scrolling. And learning how to unprotect an excel sheet (when you need to edit a template) can solve a frustrating roadblock in seconds.
You can pick up these skills through free Excel training and excel practice online. Many top performers learn on their own time with free tutorials. One study found that mastering Excel could add between $15,000 and $30,000 to your annual income. We already mentioned the YouTube breakdown of that exact finding.
If you want to start cleaning up your pipeline today, check out our guide on how to remove duplicates in Excel for accurate sales commission calculations. It is a simple step that keeps your data reliable. And for a bigger picture, read our advice on how to build a structured sales training curriculum that drives results. That will help you turn these skills into real income growth.
Tracking Your Sales Funnel with Excel
You have a long list of leads. Some are ready to buy. Others disappeared months ago. If you try to track all that in your head, you will miss opportunities. Actually, you are probably losing money right now without knowing it.
The fix is a simple lead tracker. It does not need to be fancy. Just a few columns can change everything.
Here is a clean way to start:
| Company | Contact | Stage | Value | Probability |

|———|———|——-|——-|————-|
| ABC Corp | Jane Smith | Demo Scheduled | $10,000 | 40% |
| XYZ Inc | Bob Lee | Proposal Sent | $25,000 | 60% |
| 123 Co | Amy Wu | Closed Won | $5,000 | 100% |
| Best LLC | Tom Ray | Lost | $8,000 | 0% |
Add a row for each lead. Fill in the stage, the dollar amount, and your honest probability of closing. This one sheet gives you an instant picture of your pipeline.
Now use conditional formatting to spot problems fast. For example, turn a cell red if a deal has been in "Negotiation" for more than 30 days.
That visual hint tells you to follow up or move on. You can learn this by watching the Top 10 Excel Skills You Actually Need in 2026 walkthrough on YouTube.
Free templates are out there too. Microsoft offers pre-built sales trackers you can download and fill in. This is where free excel training and excel practice online really pay off. You can start using a template today without building anything from scratch.
A manager I know taught his whole team to do this. He told me every sales analyst on his staff now spends 20 minutes a week on their funnel instead of two hours guessing.
If your data gets messy over time, check out our guide on how to remove duplicates in Excel for accurate sales commission calculations. Clean data means clean forecasts. And clean forecasts mean more confidence when you talk to your boss about your next commission check.
Forecasting Future Revenue with Simple Functions
Now that your pipeline is clean and organized, the real magic begins. You can see the future. Well, at least your commission future.
A simple SUMIF function can add up all the deal values at each stage of your funnel. Combine that with a probability percentage, and you get a weighted forecast.

Let us say you have $50,000 in deals at 40% probability. SUMIF gives you $20,000 in expected revenue. Do that across all stages, and you have a rolling forecast that updates every time you change a stage.
You are not alone in doing this. A 2024 survey found that 86% of financial professionals still trust Excel for budgeting and forecasting [1]. It is a core skill that employers look for in 2026 [2].
If these formulas sound tricky, do not worry. You can find free excel training online that walks you through SUMIF step by step. Websites like GoSkills offer excel practice online so you can learn by doing. Building these skills directly boosts your income potential. You can learn more about choosing the right training in our guide on how to choose online learning platforms for commission sales training to boost your income.
To make a rolling 30-day forecast, just add a column for "Expected Close Date." Then use a SUMIFS function to check which deals fall within the next 30 days. Every morning, it recalculates. You always know your expected income for the month.
This forecast does more than impress your manager. It calms your brain. You can plan your personal budget around a realistic number instead of hoping for the best. A sales analyst might build complex models, but you only need a sheet you can update in 10 minutes. That is real power.
Mastering Sales Pipeline Management with Excel
Now that you can forecast your income, you need the pipeline that feeds it. Think of your pipeline as the engine behind that forecast. Every deal, every lead, every follow up lives here.
A structured pipeline is the backbone of consistent commission income. Without it, you are just guessing. With it, you know exactly where each deal stands and what you need to do next.
Excel lets you build this pipeline from scratch. You do not need expensive CRM software. Just a blank sheet and a few columns. Name, company, deal value, stage, expected close date, and notes. That is all it takes to start.
For example, a simple sales pipeline tracker template from Gong shows you how to track deals from first contact to close [1]. You can download it for free and customize it however you want.
Here are a few tips to get the most out of your pipeline:
- Add stage columns. Use dropdown menus to move deals from "Prospecting" to "Proposal" to "Closed Won."
- Freeze your header row. That way, you always see your column names when scrolling. This is a simple trick, but it saves huge time.
- Remove duplicates regularly. Duplicate entries mess up your forecast fast. You can learn how to keep your data accurate in our guide on how to remove duplicates in Excel for accurate sales commission calculations.
A well managed pipeline does more than organize deals. It helps you spot stalled opportunities before they die. You can prioritize your calls and emails around the deals that matter most.
If you are new to building pipelines in Excel, do not worry. Free Excel training is everywhere. Websites like GoSkills offer excel practice online so you can learn by building your own sheet. A sales analyst might use complex dashboards, but you only need a simple sheet you update in 10 minutes each morning.
Mastering this skill directly boosts your commission income. You stop reacting and start leading.
Building a Dynamic Lead Tracker
Now that you have the basics down, let’s make your lead tracker work harder for you. A dynamic tracker does not just hold data. It helps you take action every single day.
Start by adding a few extra columns. Include lead source, contact date, next action, and expected close date. These fields tell you where your leads come from and what you need to do next. If you are a sales analyst, this level of detail helps you spot trends fast.
Next, use data validation to create dropdown menus for stage and status. This keeps your entries clean and consistent. No more typing "Hot Lead" six different ways. You can find simple guides on how to build these dropdowns through free excel training online. Sites like GoSkills offer excel practice online so you can test these features yourself.
Here is the trick that saves serious headaches. Protect your sheet but allow input only in certain cells. That way, you never accidentally delete a formula or mess up a column. You can learn how to unprotect an excel sheet later if you need to edit the structure, but for daily use, those input cells should be the only unlocked spots.
A well protected tracker with smart dropdowns keeps your pipeline accurate. It turns your simple sheet into a tool that does the organizing for you. Combine it with techniques like how to freeze a column in excel, and you will never lose your place again.
If you want to build even stronger tracking habits, check out our guide on how to choose online learning platforms for commission sales training to boost your income. It helps you find the right resources to master Excel and sales skills together.
Using PivotTables to Analyze Conversion Rates
You have built a clean, protected tracker. Now let it do the heavy lifting. PivotTables are the fastest way to turn your lead data into clear answers.
Select your entire data range, including the columns for lead source, sales rep, product, stage, and close status. Go to Insert > PivotTable. Drag lead source into the Rows box, and stage or close status into the Values box. Count the wins or calculate the percentage. In seconds, you see which source produces the highest win rate. The same trick works for reps and products.
Here is the real value. A recent guide on sales pipeline analysis in Excel shows how to use PivotTables to spot bottlenecks. You can see the stage where deals stall most often. Maybe leads drop off during proposal review. Or the demo stage has a low conversion. Once you identify the exact spot, you can fix it. That is how you turn raw numbers into smarter tactics.
As a sales analyst, this is your secret weapon. You can slice the data by month, rep, or product without writing a single formula. And if you want to practice building PivotTables from scratch, look for free excel training that includes hands-on exercises. Many sites let you work with sample data so you gain confidence fast.
Using PivotTables regularly keeps your strategy data driven. You stop guessing and start acting on what actually works. For more ways to sharpen your skills, check out our guide on how to build a structured sales training curriculum that drives results. It will help you turn insights into action across your whole team.
Excel for High-Ticket Closing: Data-Driven Negotiation
High-ticket sales, where a single deal can be $5,000 or more, demand a different level of preparation. You cannot wing it. You need hard data to back up your negotiation strategy. That is where Excel becomes your most powerful tool.
Start by analyzing your historical deals. Pull up your tracker and look for patterns. Which products had the highest win rate? What common traits did your closed-won deals share? Was it a specific lead source, a faster response time, or a certain discount level? Use Excel filters and sort functions to spot these trends. A simple trick like learning how to freeze a column in Excel keeps your headers visible as you scroll through hundreds of rows. That is the kind of practical skill every sales analyst needs.
Once you see the patterns, build a deal scoring model. This ranks your open deals by how likely they are to close. Assign points for factors like deal size, engagement level, and stage in pipeline.

Companies like HubSpot already use predictive deal scores to forecast win probability. You can build a similar system in Excel with basic formulas. Score each prospect and sort your list by priority. This way you focus your energy on the deals that matter most.
If you are new to building models in Excel, look for free excel training that covers functions like VLOOKUP and conditional formatting. Many platforms also offer excel practice online with sample data sets so you can test your scoring model before using it on real leads. For more guidance on finding the right training, check out our tips on how to choose online learning platforms for commission sales training.
With a solid deal scoring model, you walk into every negotiation with clear priorities. You know exactly which prospects deserve your best effort. That data-driven confidence turns more high-ticket conversations into closed deals.
Analyzing Historical Deal Data
Your CRM holds a goldmine of information about your past wins and losses. But raw data straight from the system is usually a mess. Before you can find useful patterns, you need to clean it up.
Start by exporting all your closed deals into Excel. Remove duplicate entries and fix inconsistent formatting. As a sales analyst, you will often need to know how to unprotect an excel sheet when your company uses protected templates. Cleaning your data first prevents bad conclusions later. According to a high-ticket sales guide, top performers always base their strategy on real data, not gut feelings.
Once your data is clean, build scatter plots. Put deal size on one axis and time to close on the other. Look at the clusters. Do your biggest deals always take longer to close? Or do some small deals drag out for months? This visual view helps you set better expectations for future negotiations. This method works well alongside a formal deal scoring framework that ranks your open pipeline.
Now look at your lost deals. What objections came up again and again? Price? Timing? Trust? Tag each lost deal with the main reason and use Excel filters to group them. You might find that prospects from a certain industry always push back on the same issue. That is a pattern you can prepare for.
To build these skills, find free excel training that covers scatter plots and data filters. Many platforms offer excel practice online with downloadable data sets. The more you practice, the better you get at spotting trends. That means you enter every high-ticket negotiation with real evidence on your side.
Creating a Deal Scoring Model
Now that you have clean historical data, use it to build a deal scoring model that ranks your open pipeline. The goal is to assign points for budget, authority, need, and timeline (BANT). Give each factor a score based on how strongly it predicted a win in your past deals. For example, if prospects with a clear budget closed 80% of the time, that factor gets more points. This approach is central to a modern deal scoring framework that turns buyer input into a reliable forecast.
Weight each BANT factor according to its historical importance. If authority was the biggest barrier in lost deals, give it a higher weight. You can create the model in Excel using simple formulas. Then use conditional formatting to automatically highlight high-scoring leads in green. That way you focus your energy where it counts most.
To build these Excel skills, look for free excel training that covers conditional formatting and weighted scoring. Many sites offer excel practice online with real sales data sets. For a structured approach, check out this guide on how to choose online learning platforms for commission sales training. The more you practice, the faster you can score every deal and prioritize your time on the ones most likely to close.
Maximizing Commission Structures with Excel Models
Understanding your comp plan is the first step to earning more. But here is the truth: most sales reps barely skim their commission agreement. They know their rate and maybe a quota. But they miss the fine print that can cost them thousands.
Excel changes that. It lets you model every scenario your plan throws at you. Tiered structures, residual payouts, accelerators, clawbacks. You can build a personal commission calculator that shows exactly how each deal affects your income.
Think about it this way. Say your plan has a 10% rate up to $50,000 and then jumps to 15%. That extra 5% on every dollar above the threshold is pure motivation. But only if you can see the numbers in real time. A simple compensation calculator in Excel lets you plug in your expected close dates and watch your projected earnings change.
You can also use templates to get started fast. Many sites offer a free commission tracking template that handles the heavy lifting. Just enter your deals and let the formulas do the work. Some templates even support different payout limits and calculation methods.
But to really master your model, you need solid skills. That is where free excel training comes in. You can find courses that teach you how to build weighted formulas, use IF statements, and create scenario managers. Practice with real sales data from excel practice online resources. The better your model, the clearer your focus.
And do not forget data accuracy. If your commission log has duplicate entries or formatting errors, your projections will be wrong.

Learning how to remove duplicates in Excel for accurate sales commission calculations will save you from painful surprises at payout time.
A personal calculator keeps you honest. It shows you which activities actually move your income needle. Chasing a $10,000 deal with a 5% payout? That is only $500. But a $5,000 residual deal that pays every month? That adds up fast. Your Excel model makes those tradeoffs obvious.
So build your model today. Download a template, watch a tutorial, and start running your own numbers. Your commission check will thank you.
Modeling Different Compensation Plans
Not all compensation plans are built the same. Some have caps that limit how much you can earn. Others include accelerators that boost your rate once you exceed quota. And a few even have clawbacks that take money back if a customer cancels. To really understand your plan, you need a model that lets you change the commission rate and see the effect on your payout instantly.
Here is how you build one in Excel. Start with a simple calculator that lets you adjust the base rate. Then add dropdowns or input cells for caps, accelerators, and clawbacks. For example, if your plan has a cap at $100,000, your formula should stop counting revenue above that threshold. This kind of detailed model helps you see exactly which deals move your needle.
The good news is you do not have to start from scratch. Many free templates are available online. For example, the Sales Commission Calculator Excel Template from Xappex works in both Excel and Google Sheets and lets you adjust tiers and payout limits.

You can also find a free commission tracking template from QuotaPath that supports different payout structures.
A sales analyst often builds these models to forecast team earnings, but you can use them for your own planning too. If you want to level up your skills, look for free excel training that teaches you how to write formulas with IF statements, VLOOKUPs, and scenario managers. Practicing with excel practice online resources will make you faster and more accurate. And if you ever need to protect your work, learning how to unprotect an excel sheet or how to freeze a column in excel will keep your model clean and easy to use.
Once your model is ready, test it with real numbers. Change the commission rate from 10% to 15% and watch your projected income jump. That visual feedback keeps you focused on the activities that actually pay.
For more advanced training on building these skills, check out our guide on how to choose online learning platforms for commission sales training. It will help you find the right course to master Excel modeling for sales careers.
Calculating Your Optimal Performance Targets
You have built a model that shows how different commission rates change your payout. That is a great start. But now you need to find your actual target. How many deals must you close this year to hit your income goal?
Excel has a tool called Goal Seek that does this for you. It works backward. You tell it your desired income, and it calculates the number of deals or total revenue needed. Let me show you how to use it in your commission calculator.
Here is the simple process:
- Set up a cell for your projected payout based on deal count.
- Go to the Data tab and click What-If Analysis, then Goal Seek.
- In the box, select the cell with your payout as the "Set cell."
- Type your income target in the "To value" field.
- Select the cell with your deal count as the "By changing cell."
- Click OK, and Excel finds the number of deals you need.
For example, if you want to earn $100,000 in commission and your average deal pays $2,000, Goal Seek will show you need to close 50 deals. This kind of clarity changes how you work each day.
Once you have your annual number, break it down. Divide by 12 for a monthly target. Then divide by 4 for a weekly target. If you need 50 deals a year, that is about 4 deals per month or 1 deal per week. Suddenly your goal feels manageable.
This breakdown reduces stress because you are not staring at a huge annual number. You focus on closing your one deal this week. A sales compensation calculator in Excel makes this process fast and repeatable.
To keep your model clean while you work, learn how to freeze a column in excel. That way your headers stay visible as you scroll through your deal list. And if you share your file, know how to unprotect an excel sheet so you can edit formulas later.
Practicing these techniques will make you faster. Look for free excel training online that covers Goal Seek and scenario managers. Many resources offer excel practice online with real-world sales data. A sales analyst uses these tools daily, but you can use them too.
When you see your weekly target clearly, motivation goes up. You know exactly what to do next.
For a step-by-step guide on building these skills, check out our article on how to choose online learning platforms for commission sales training. It will help you find courses that teach Goal Seek and other advanced Excel features.
Free Excel Training Resources for Sales Professionals
You have learned how to use Goal Seek to find your deal targets. That is a powerful skill. But what if you want to get even better at Excel without spending a lot of money? Here is the good news. You do not need expensive courses to gain Excel mastery.
Many top universities and organizations offer free Excel training that can take you from beginner to advanced levels. The key is knowing where to look and what to focus on as a sales professional.
Where to find free Excel training
Platforms like Alison offer free online Excel courses that cover everything from basic formulas to advanced data analysis.
These courses are self-paced, so you can learn when your schedule allows.
Coursera also provides free Excel courses from top universities. You can learn about pivot tables, data visualization, and complex formulas. The best part? You can audit many courses at no cost.
For quick tutorials, check out the Advanced Excel Full Course 2026 on YouTube. Video learning works great when you want to see formulas in action.
Focus on sales-specific templates and case studies
As you learn, look for training that uses real sales data. Practice with your own commission numbers. Build spreadsheets that track your pipeline. This is where excel practice online becomes valuable. Many free resources let you download sample files and work through exercises at your own pace.
When you practice with sales data, you learn two things at once. You improve your Excel skills, and you understand your commission structure better.
Specific skills to master
Start with basics like how to freeze a column in excel so your headers stay visible. Then move to intermediate skills like how to unprotect an excel sheet so you can edit formulas in shared files. These small skills save you time every single day.
For data cleaning, read our guide on how to remove duplicates in Excel for accurate sales commission calculations. Clean data means accurate payouts.
A sales analyst uses these tools daily. But you can use them too. The difference is just a few hours of focused practice.
Build a learning routine
Set aside 20 minutes each day for free excel training. Watch one tutorial, then apply it to your own commission calculator. This hands-on approach sticks better than just reading.
For a structured approach to building your skills, check out our article on how to choose online learning platforms for commission sales training. It will help you find the best courses for your specific needs.
Remember, every expert was once a beginner. Start today with one free resource, and you will be surprised how fast you improve. Your commission calculator will thank you.
Top Free Online Courses in 2026
So you know free Excel training is out there. But with so many options, where do you actually start? Here are the top places to get free excel training that works for sales pros.
Microsoft’s own training. This is the most obvious and often the most overlooked. Microsoft offers free tutorials and modules directly on their support site. They cover everything from how to freeze a column in excel to building complex formulas for sales reports. Since they created Excel, their training is always accurate and up to date.
Coursera and edX. Both platforms let you audit courses for free. You get full access to video lectures and reading materials. You just do not get a certificate unless you pay. The Excel courses on Coursera cover data visualization, pivot tables, and real business case studies. This is perfect excel practice online because you work with actual datasets.
LinkedIn Learning. They offer a free trial. If you binge watch during one month, you can learn a ton. Their Excel courses are short and practical. They focus on skills a sales analyst would use every day.
YouTube channels. Free and always available. Channels like ExcelIsFun and Leila Gharani have dedicated playlists for sales and finance. The Advanced Excel Full Course 2026 on YouTube covers advanced formulas you can apply to your commission calculator right away.
Structured vs. self-paced. Pick what fits your style. Structured courses from Alison or Learning Saint give you a clear path. Self-paced YouTube lets you jump to exactly what you need. For more guidance on picking the right platform, check out our article on how to choose online learning platforms for commission sales training.
The best course is the one you actually finish. Start with one option today. Even 15 minutes will move you forward.
Free Spreadsheet Templates for Sales
Once you finish a training course, putting those skills to use right away helps them stick. That is where free spreadsheet templates come in. They save you from starting with a blank page and give you a structure you can customize instantly.
Look for templates with built in formulas and conditional formatting. A sales commission tracker should automatically calculate totals when you enter a deal. Conditional formatting can highlight your biggest wins in green or flag overdue tasks in red. This turns your excel practice online into real productivity.
Where do you find high quality templates? Start with Microsoft’s official template gallery. They offer sales reports, invoices, and client trackers. Sales experts and training blogs also share custom templates for specific needs. For structured learning on how to use these templates effectively, check out the free courses on Alison or Coursera that include real world datasets. When choosing a template for your team, pay attention to features that support business workflows, as outlined in this guide on best online Excel training for employees.
Here are two practical skills you will need as a sales analyst:
- How to unprotect an excel sheet. Many templates lock cells to prevent mistakes. Knowing how to unprotect them lets you adjust formulas for your unique commission structure.
- How to freeze a column in excel. This keeps your header row visible while you scroll through hundreds of entries. It is a small time saver that makes a big difference.
Before you start customizing a template, make sure your data is clean. Read our guide on how to remove duplicates in Excel for accurate sales commission calculations.
Templates bridge the gap between free excel training and real world results. Download one today, make it your own, and watch your sales tracking become effortless. For more on building a complete sales system, see our article on how to build a structured sales training curriculum that drives results.
Using Excel for Appointment Setting Efficiency
You have the training. You have the templates. Now comes the part that actually makes you money: booking qualified appointments. Without a system, appointment setting turns into chaos. You forget to follow up. You lose leads. You waste time digging through emails.
Excel fixes this. With the right setup, you can track every prospect from first contact to confirmed meeting. Think of your spreadsheet as a command center. Each row is a lead. Each column shows their status, last touchpoint, and next action.
Start with a simple sales pipeline tracker. A free excel training course can show you how to build one, but you can also grab a ready made template from sites like Gong or the Sales Enablement Collective. These templates give you columns for lead name, company, contact date, follow-up date, and current stage.
Here is the trick for automation. Use conditional formatting to highlight leads that need attention today. Set a rule so that any cell in your follow-up date column that matches today’s date turns bright red. Now you never miss a follow-up. You can build on this skill with more excel practice online to learn advanced formulas like VLOOKUP or XLOOKUP that pull prospect data from a master list automatically.
To keep your tracker tidy as a sales analyst, you need two basic skills. First, how to unprotect an excel sheet so you can adjust the template for your specific workflow. Second, how to freeze a column in excel so your header row stays visible while you scroll through hundreds of leads. Both are simple to learn and save hours of frustration.
Also clean your data regularly. A list with duplicate prospects wastes your time. Read our guide on how to remove duplicates in Excel for accurate sales commission calculations to keep your pipeline accurate.
Combine your Excel tracker with a free calendar tool and a free email scheduler. Now you have a full appointment setting system without paying for expensive CRM software. For more on building a complete sales workflow, check out our article on how to choose online learning platforms for commission sales training to boost your income.
Your spreadsheet is more than a list. It is your daily guide to who to call and what to say next. Set it up once, and watch your booked appointments grow.
Automating Prospecting Lists
Your pipeline is only as good as the leads you feed into it. Instead of manually building every list, use these three Excel tricks to automate the boring parts.
First, stop typing the same introduction over and over. Use the TEXTJOIN or CONCATENATE formula. You can place a greeting in one cell, a prospect’s first name in another, their company name in a third, and your standard pitch in a fourth. The formula stitches them together into a personalized email body.

This alone saves hours each week and is a core skill you can learn with free excel training.
Next, where do your leads come from? Maybe you have a list from LinkedIn, an old spreadsheet, and a purchase list from a data provider. Instead of copying and pasting, use Power Query. This free built-in Excel tool can combine data from multiple sources, remove errors, and load everything into one clean master sheet. It is a must-know skill for any sales analyst. You can explore other advanced techniques in this guide on Mastering Sales Pipeline Tracking in Excel.
Finally, randomize your call lists to remove bias. Add a new column next to your data and enter the =RAND() formula. Excel fills the column with random numbers. Now sort your entire list by that column. You have a fresh, unbiased calling order. This is a great piece of excel practice online to add to your routine.
Automating these steps keeps your focus on selling. And remember, a clean list is an effective list. Read our guide on how to remove duplicates in Excel for accurate sales commission calculations to keep your data free of errors.
Tracking Outreach and Follow-ups
You have a clean list of leads and your emails are personalized. But here is where most sales reps drop the ball. They forget to follow up. Actually, a single touch rarely closes a deal. You need a system that tells you exactly who to call and when.
Start by logging every contact attempt. Create a simple table in your sheet. Each row is one outreach. Add columns for the date, the prospect name, the outcome (like "left voicemail" or "sent proposal"), and the next action. This single step turns a messy inbox into a clean record. You can use a free excel training course to learn how to build this log quickly.
Now make your sheet work for you. Use conditional formatting to flag overdue follow-ups. Here is how. Set a rule that turns a cell red if the next action date is in the past and the status is not "closed." When you open your sheet each morning, you see a red list of people you need to contact right away. This is a great way to improve your excel practice online skills.
Finally, build a simple heat map to find your best calling times. Track the day of week and time of day for each successful call. Then use conditional formatting with a green-to-red color scale on a grid of days and times. The green cells show your golden hours. Use those slots for your most important calls. This technique is a valuable skill for any sales analyst looking to boost conversion rates.
Mastering this tracking process is a foundational piece of a broader skill set. To go deeper, read our guide on how to build a structured sales training curriculum that drives results. It will help you turn these individual tactics into a repeatable sales system.
For a complete walkthrough on building a pipeline tracker from scratch, check out this guide on Mastering Sales Pipeline Tracking in Excel. It includes step-by-step instructions for the log, conditional formatting, and heat map techniques mentioned above.
Avoiding Burnout: Excel for Performance and Motivation Tracking
Commission-only roles can wear you down. When every call feels like a high-stakes gamble and your income swings wildly, motivation takes a hit. The research backs this up: in 2026, 86% of financial professionals still rely on Excel for budgeting and forecasting, according to a PayEm survey cited by Nockpoint. That is because Excel helps you see the big picture. And seeing the big picture is exactly what prevents burnout.
Here is the simple fix. Build a personal performance dashboard in your spreadsheet. This is not complicated. Create a small section at the top of your sheet that shows your weekly wins, your total commission earned so far, and your closest deals. Every time you update your log, the dashboard updates too. That constant visual reminder keeps your momentum strong. You can learn how to set this up with a free excel training course that covers basic formulas and chart creation.
Now add goal tracking with conditional formatting. Set a monthly commission target in one cell. Then create a progress bar using a simple formula. When your actual earnings reach 50% of your goal, the cell turns yellow. At 80%, it turns green. This gives you a small dopamine hit every time you check your sheet. It turns a tough sales day into a visual game. That daily motivation is huge for any sales analyst trying to stay consistent.
Finally, keep your dashboard clean and easy to scan. Use the freeze panes feature so your goal tracker stays visible no matter how far you scroll. If you do not know how yet, learning how to freeze a column in excel takes about 30 seconds and makes a massive difference.
Tracking your outreach prevents chaos. Tracking your wins prevents burnout. Together they keep you in the game longer and earning more.

For more ways to build a solid sales foundation, check out our guide on how to choose online learning platforms for commission sales training to boost your income.
Creating a Personal Sales Dashboard
You have your performance log and your motivation tracker. Now it is time to see everything in one place. A personal sales dashboard turns raw numbers into a clear picture you can check every day. This is exactly what keeps you focused and prevents the burnout we talked about.
Start with three simple charts. One for weekly commission earned, one for calls made, and one for deals closed. You do not need fancy software. Even in 2026, two thirds of office workers use Excel at least once every hour, according to Acuity Training. That means the tool is already right in front of you. Just highlight your data and insert a basic bar chart. It takes 30 seconds.
Now add sparklines next to your weekly totals. Sparklines are tiny line graphs that fit inside a single cell. They show trends at a glance. You can see if your call volume is rising or falling without digging through columns. This is a skill every sales analyst should know, and it is easy to learn with some excel practice online.
Make it a ritual. Every morning, open your dashboard first. Update yesterday’s numbers. Watch the charts move. That small habit keeps your goal front and center. If you need help getting started, a free excel training course can walk you through building charts and formatting dashboards in under an hour.
Keep your dashboard clean. Use freeze panes so your header row and goal cells always stay visible. And if you ever need to edit a protected template, you can learn how to unprotect an excel sheet in a few clicks.
For more ways to build efficient workflows, check out our guide on how to remove duplicates in Excel for accurate sales commission calculations. Clean data means a clean dashboard, and a clean dashboard means more time selling.
Setting and Monitoring Goals with Conditional Formatting
You have your dashboard showing calls and commissions. But are you hitting your targets? Looking at plain numbers takes effort. Conditional formatting does the work for you. It makes your goals visible at a glance.
First, set monthly targets. Highlight your progress column. Go to Conditional Formatting and choose Data Bars. These bars fill up like a gas gauge. You can see exactly how close you are to your goal. If you need help, a full free excel training module walks you through conditional formatting step by step. It takes less than a minute to set up.
Next, add a color scale. This is the red-amber-green system that top teams use.
- Red: You are behind schedule (under 50% of target).
- Amber: You are on track but need to push (50% to 99%).
- Green: Goal met or exceeded.
This is a standard skill for any sales analyst, and you can build it with a bit of excel practice online. It turns your whole month into a visual report. You know exactly where to focus today the second you open the file.
Here is the real reason this works. Every time a cell turns green, you get a small win. That feeling keeps you going. It is hard to burn out when you celebrate progress every few days. These micro-wins build momentum.
And if you ever need to edit a locked template from your manager, knowing how to unprotect an excel sheet will save you a headache. For more ways to build skills that turn these daily habits into lasting success, check out our guide on how to build a structured sales training curriculum that drives results.
Conclusion: Take the Next Step to Boost Your Commission Income
Excel is one of the most powerful tools you can use in a commission-based sales career. And the best part? It is completely free to use if you already have the software or a free online version. With a little practice, you can turn a blank spreadsheet into a command center that shows your progress, keeps you motivated, and helps you hit your targets.
Do not try to build the perfect system all at once. Start with one small spreadsheet today. Track your calls for a week. Add your commission numbers. Set one goal. That is enough. As you get comfortable, you can add conditional formatting, data bars, and color scales. Each step makes your data work harder for you.
The key is consistency and reinvesting in your skills. Every time you learn a new Excel trick, you become more efficient. There are many ways to sharpen your abilities. For example, you can find free Excel training through platforms like Alison, which offers courses for all levels. Or you can take structured programs through Coursera to go deeper into data analysis and visualization techniques. These skills make you a stronger sales analyst and a more valuable earner.
Trust your data. Stay consistent with your tracking. And keep learning. The next step is to explore other skills that can grow your income. Check out our guide on how to choose online learning platforms for commission sales training to boost your income for more ideas on building your career.
Summary
This article explains how mastering a handful of Excel skills can significantly increase commission income by turning messy leads into predictable revenue. It walks you through practical, sales-focused uses of Excel: building and cleaning a pipeline, forecasting with weighted formulas, creating deal-scoring models, modeling compensation plans, and using PivotTables to spot conversion bottlenecks. The guide covers simple automation tricks, templates, and free training resources so you can start fast, plus techniques like Goal Seek and conditional formatting to set targets and stay motivated. By following these steps you’ll be able to prioritize high-value deals, forecast monthly payouts with confidence, automate repetitive tasks, and create a dashboard that reduces stress and improves performance.